 OnlineCalculator
What is the Variance Calculator?
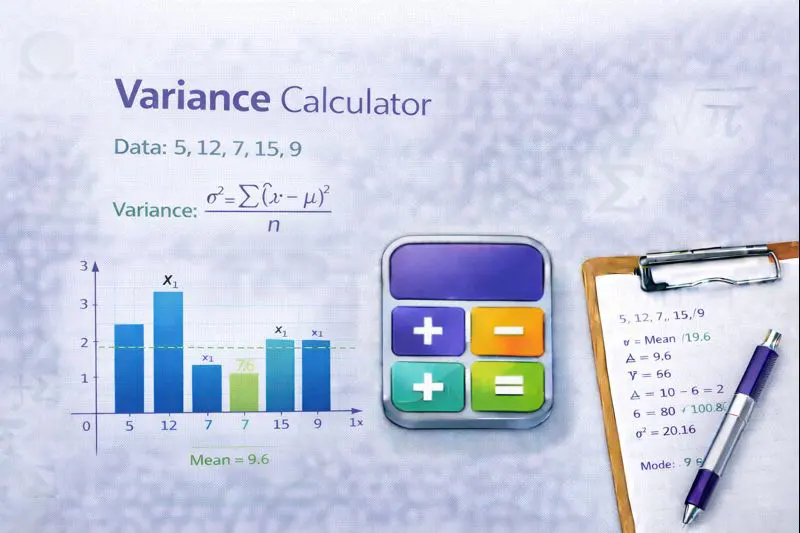
The variance calculator measures how far each number in a dataset differs from the mean (average). A high variance indicates data points are widely spread, while a low variance means they cluster closely around the mean. This metric forms the foundation of statistical analysis across every field—from finance to quality control.
Key benefits of using this calculator:
- Dual calculation modes: Compute both population variance (σ²) and sample variance (s²) simultaneously
- Step-by-step breakdown: See exactly how the variance is calculated, perfect for learning or verification
- Instant mean & deviation display: Get the mean and squared deviations alongside your variance result
- No size limits: Enter datasets of any length—from small samples to large data collections
This tool uses the mathematically proven variance formulas trusted by universities, research institutions, and professionals worldwide. Every calculation is transparent, showing you the complete process rather than just the final number. Explore more helpful tools at Online Calculator UAE.
======================================== ADVANCED VARIANCE CALCULATOR WIDGET For WordPress Elementor HTML Widget ======================================== Copy this entire code into an Elementor HTML widget Features: - Population & Sample Variance calculation - Step-by-step solution display - Mean, deviations, and squared deviations shown - Mobile responsive design - Dark/Light theme compatible - Export results functionality - Visual data chart ======================================== Header Error Message Input Section Calculate Button Results Section Results Cards Steps Section ▼ Step 1 1 Content filled by JS Step 2 2 Content filled by JS Step 3 3 Data Table Step 4 4 Content filled by JS Step 5 5 Content filled by JS Visual Chart Action Buttons
How the Variance Calculator Works
Variance quantifies the average squared deviation from the mean. The calculation follows a specific mathematical process that differs slightly between population variance and sample variance.
The Variance Formulas
Population Variance (σ²): Used when your data represents an entire population.
σ² = Σ(xᵢ - μ)² / N
Sample Variance (s²): Used when your data represents a sample from a larger population.
s² = Σ(xᵢ - x̄)² / (n - 1)
Step-by-Step Calculation Process
Step 1: Calculate the Mean
Add all values in your dataset and divide by the count. This gives you the central point around which variance is measured.
Step 2: Find Each Deviation
Subtract the mean from each data point. This shows how far each value sits from the center.
Step 3: Square the Deviations
Square each deviation to eliminate negative values and emphasize larger differences. This ensures deviations don't cancel each other out.
Step 4: Sum the Squared Deviations
Add all squared deviations together to get the total squared deviation.
Step 5: Divide by Count
For population variance, divide by N (total count). For sample variance, divide by n-1 (count minus one, known as Bessel's correction). This adjustment compensates for the bias inherent in estimating population variance from a sample.
Important Note: Sample variance uses n-1 instead of n because a sample mean tends to underestimate the true variability in a population. The n-1 denominator produces an unbiased estimate. For related calculations, try the spread measurement tool which calculates the square root of variance.
Practical Examples with Full Calculations
Example 1: Student Test Scores Analysis
A statistics professor at a Dubai university wants to analyze test score variability for a class of 8 students. The scores are: 72, 85, 78, 92, 68, 88, 76, 81.
Step 1: Calculate the Mean
Mean = (72 + 85 + 78 + 92 + 68 + 88 + 76 + 81) / 8
Mean = 640 / 8 = 80
Step 2: Calculate Squared Deviations
- (72 - 80)² = (-8)² = 64
- (85 - 80)² = (5)² = 25
- (78 - 80)² = (-2)² = 4
- (92 - 80)² = (12)² = 144
- (68 - 80)² = (-12)² = 144
- (88 - 80)² = (8)² = 64
- (76 - 80)² = (-4)² = 16
- (81 - 80)² = (1)² = 1
Step 3: Sum Squared Deviations
Sum = 64 + 25 + 4 + 144 + 144 + 64 + 16 + 1 = 462
Step 4: Calculate Variance
Population Variance (σ²) = 462 / 8 = 57.75
Sample Variance (s²) = 462 / 7 = 66
Result: The sample variance of 66 indicates moderate spread in test scores. Students performed fairly consistently around the 80-point average.
Example 2: Monthly Sales Data for Abu Dhabi Retail Store
A retail manager tracks monthly sales (in thousands AED) over 6 months: 45, 52, 48, 61, 44, 50. They want to understand sales consistency.
Step 1: Calculate the Mean
Mean = (45 + 52 + 48 + 61 + 44 + 50) / 6
Mean = 300 / 6 = 50
Step 2: Calculate Squared Deviations
- (45 - 50)² = 25
- (52 - 50)² = 4
- (48 - 50)² = 4
- (61 - 50)² = 121
- (44 - 50)² = 36
- (50 - 50)² = 0
Step 3: Sum and Calculate
Sum = 25 + 4 + 4 + 121 + 36 + 0 = 190
Sample Variance = 190 / 5 = 38
Result: A sample variance of 38 (thousands AED squared) suggests moderate month-to-month sales fluctuation. The June spike of AED 61,000 significantly impacts the variance. Use the average finder tool for quick mean calculations.
Example 3: Manufacturing Quality Control (Low Variance Scenario)
A precision manufacturing company in Jebel Ali measures component weights in grams. Five samples weigh: 10.2, 10.1, 10.0, 10.1, 10.1. Quality standards require minimal variance.
Step 1: Calculate the Mean
Mean = (10.2 + 10.1 + 10.0 + 10.1 + 10.1) / 5
Mean = 50.5 / 5 = 10.1
Step 2: Calculate Squared Deviations
- (10.2 - 10.1)² = 0.01
- (10.1 - 10.1)² = 0
- (10.0 - 10.1)² = 0.01
- (10.1 - 10.1)² = 0
- (10.1 - 10.1)² = 0
Step 3: Calculate Variance
Sum = 0.01 + 0 + 0.01 + 0 + 0 = 0.02
Sample Variance = 0.02 / 4 = 0.005
Result: The extremely low sample variance of 0.005 demonstrates excellent manufacturing consistency. Components are nearly identical in weight, meeting tight quality tolerances.
Important Information About Variance Calculations
When to Use Population vs. Sample Variance
Use Population Variance (σ²) when:
- You have data for every member of the group you're studying
- Analyzing complete census data
- Working with the entire dataset of interest (e.g., all employees in a small company)
Use Sample Variance (s²) when:
- Your data represents a subset of a larger population
- Conducting surveys or research studies
- Making inferences about a population from collected samples
Common Mistakes to Avoid
Mixing up population and sample formulas: Using the wrong denominator (N vs. n-1) leads to biased results. When in doubt with sample data, use n-1.
Forgetting to square deviations: Raw deviations sum to zero. Squaring is essential to measure actual spread.
Misinterpreting variance units: Variance is expressed in squared units of the original data. For interpretable spread, take the square root to get standard deviation.
Ignoring outliers: Variance is sensitive to extreme values. A single outlier can dramatically inflate variance. Consider identifying and investigating outliers before concluding about data spread.
Expert Tips
Compare variance across different datasets by using the coefficient of variation (standard deviation divided by mean). This provides a unitless comparison. For probability-related variance questions, explore the likelihood computation tool.
Frequently Asked Questions
What is the difference between variance and standard deviation?
Variance measures the average squared deviation from the mean, while standard deviation is the square root of variance. Standard deviation is expressed in the same units as your original data, making it more intuitive for interpretation. Both measure data spread, but standard deviation is often preferred for reporting.
Why does sample variance divide by n-1 instead of n?
This adjustment, called Bessel's correction, compensates for the fact that a sample mean underestimates the true population variability. Using n-1 produces an unbiased estimate of the population variance. Without this correction, sample variance would systematically underestimate the true variance.
Can variance be negative?
No, variance can never be negative. Since all deviations are squared before averaging, the result is always zero or positive. A variance of zero means all data points are identical to the mean—there's no spread whatsoever.
How do I interpret a high vs. low variance?
High variance indicates data points are widely scattered from the mean—there's significant variability in your dataset. Low variance means data points cluster tightly around the mean—the values are relatively consistent. Context matters: what's "high" for one application may be "low" for another.
What's the minimum number of data points needed to calculate variance?
You need at least two data points for sample variance (since n-1 would be zero with one point). For population variance, technically one point gives a variance of zero. Meaningful variance analysis typically requires more data points for reliable insights.
How does variance relate to other statistical measures?
Variance connects to several key statistics. Standard deviation is its square root. Variance forms the basis for hypothesis testing, ANOVA, and regression analysis. It also helps calculate confidence intervals. Explore more in our math and statistics section.
Is this calculator accurate for academic or professional use?
Yes, this calculator uses the standard mathematical formulas for variance accepted in academic and professional settings. The step-by-step display allows you to verify calculations. For critical applications, always double-check results and consider using statistical software for very large datasets.
Can I calculate variance for grouped data or frequency distributions?
This calculator works with raw data values. For grouped data (frequency distributions), the formula requires modification to account for frequencies. Enter individual values or multiply each value by its frequency count when applicable.
Start Calculating Variance Now
Enter your dataset above and get instant variance results with complete step-by-step calculations. Whether you're checking homework, analyzing business data, or conducting research, this tool delivers accurate results in seconds.
For deeper statistical analysis, combine variance calculations with other statistical measures. Understanding data spread helps you make more informed decisions based on the consistency and reliability of your data.
Questions about statistical methods? Academic resources like Khan Academy Statistics offer excellent tutorials on variance and related concepts.
Related Calculators
- Standard Deviation Calculator - Calculate the square root of variance for interpretable spread measurement
- Mean Calculator - Find the average of your dataset quickly
- Median Calculator - Determine the middle value in your data
- Mode Calculator - Identify the most frequent value
- Statistics Calculator - Comprehensive statistical analysis in one tool
- Probability Calculator - Calculate event probabilities and distributions