 OnlineCalculator
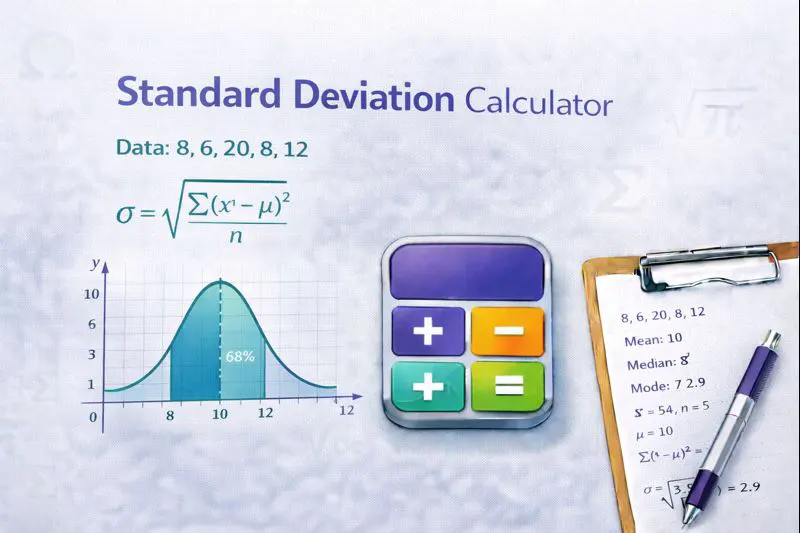
What Is a Standard Deviation Calculator?
A standard deviation calculator measures how spread out numbers are from their average value. This statistical measure helps you understand data variability—whether your values cluster tightly around the mean or scatter widely across a range.
Our calculator handles both , giving you flexibility based on your dataset type. You'll receive instant results along with variance, mean, sum, and a detailed calculation breakdown.
Key benefits of using this tool:
- Calculates both population and sample standard deviation simultaneously
- Shows complete step-by-step solution for learning and verification
- Handles datasets of any size with decimal precision
- Provides additional metrics including variance, mean, sum, count, and coefficient of variation
Trusted by students, educators, and professionals across industries, this calculator follows the exact formulas used in academic and professional statistical analysis.
Advanced Standard Deviation Calculator - WordPress Elementor Compatible Copy and paste this entire code into Elementor's HTML widget Distribution Visual Tabs 1 2 3 4 5
1 2 3 4 5
How Standard Deviation Is Calculated
Standard deviation quantifies the amount of variation or dispersion in a dataset. A low standard deviation indicates values cluster close to the mean, while a high standard deviation shows values spread over a wider range.
The Standard Deviation Formula
Population Standard Deviation (σ):
σ = √[Σ(xi - μ)² / N]
Sample Standard Deviation (s):
s = √[Σ(xi - x̄)² / (n - 1)]
Where:
- xi = each individual value in the dataset
- μ or x̄ = the mean (average) of all values
- N = total number of values (population)
- n = number of values in sample
- Σ = sum of all values
Step-by-Step Calculation Process
Step 1: Calculate the mean by adding all values and dividing by the count.
Step 2: Subtract the mean from each value to find deviations.
Step 3: Square each deviation to eliminate negative values.
Step 4: Sum all squared deviations.
Step 5: Divide by N (population) or n-1 (sample) to get variance.
Step 6: Take the square root of variance to get standard deviation.
Important note: Use population standard deviation when your dataset includes every member of the group you're studying. Use sample standard deviation when working with a subset that represents a larger population. The sample formula divides by (n-1) instead of n to correct for bias—this is called Bessel's correction.
Example 1: Student Exam Scores
A professor at a Dubai university wants to analyze the grade distribution for a statistics exam. The scores for all 8 students in the class are: 72, 85, 90, 78, 88, 92, 76, 83.
Since this includes every student (entire population), we use population standard deviation.
Step 1: Calculate the mean
Mean = (72 + 85 + 90 + 78 + 88 + 92 + 76 + 83) / 8 = 664 / 8 = 83
Step 2: Find squared deviations
(72-83)² = 121 | (85-83)² = 4 | (90-83)² = 49 | (78-83)² = 25
(88-83)² = 25 | (92-83)² = 81 | (76-83)² = 49 | (83-83)² = 0
Step 3: Calculate variance and standard deviation
Variance (σ²) = (121 + 4 + 49 + 25 + 25 + 81 + 49 + 0) / 8 = 354 / 8 = 44.25
Standard Deviation (σ) = √44.25 = 6.65
The standard deviation of 6.65 means most scores fall within about 6-7 points of the class average of 83.
Example 2: Monthly Sales Revenue Analysis
A retail manager in Dubai Marina sampled 6 months of sales data from a larger 3-year dataset: AED 45,000, AED 52,000, AED 48,000, AED 61,000, AED 55,000, AED 49,000.
Since this is a sample from a larger population, we use sample standard deviation.
Step 1: Calculate the mean
Mean = (45000 + 52000 + 48000 + 61000 + 55000 + 49000) / 6 = 310,000 / 6 = AED 51,666.67
Step 2: Find squared deviations
Sum of squared deviations = 44,444,444.44 + 111,111.11 + 13,444,444.44 + 87,111,111.11 + 11,111,111.11 + 7,111,111.11 = 163,333,333.32
Step 3: Calculate sample variance and standard deviation
Sample Variance (s²) = 163,333,333.32 / (6-1) = 163,333,333.32 / 5 = 32,666,666.66
Sample Standard Deviation (s) = √32,666,666.66 = AED 5,715.48
Monthly sales typically vary by about AED 5,715 from the average, indicating moderate revenue fluctuation. For additional financial calculations, our percentage computation tool can help with growth rate analysis.
Example 3: Quality Control Measurements
A manufacturing facility on Yas Island measures the diameter (in mm) of 5 precision components: 10.02, 9.98, 10.01, 9.99, 10.00. These represent all components in the batch.
= (10.02 + 9.98 + 10.01 + 9.99 + 10.00) / 5 = 50.00 / 5 = 10.00 mm
Squared deviations:
(10.02-10)² = 0.0004 | (9.98-10)² = 0.0004 | (10.01-10)² = 0.0001 | (9.99-10)² = 0.0001 | (10.00-10)² = 0
= 0.001 / 5 = 0.0002
= √0.0002 = 0.0141 mm
This extremely low standard deviation (0.0141 mm) indicates excellent manufacturing precision—the components are highly consistent with minimal variation from the target diameter.
When to Use Population vs. Sample Standard Deviation
Use population standard deviation (σ) when:
- You have data from every member of the group you're analyzing
- You're studying a complete, finite set (all students in a class, all products in a batch)
- Your dataset IS the population, not a representation of it
Use sample standard deviation (s) when:
- Your data represents a subset of a larger population
- You're making inferences about a larger group from limited data
- Collecting data from the entire population is impractical
Common Mistakes to Avoid
Mixing up population and sample formulas – Using the wrong formula can significantly skew your results, especially with small datasets. The sample formula corrects for the tendency of samples to underestimate population variance.
Confusing standard deviation with variance – Variance is the squared value; standard deviation is the square root of variance. Standard deviation is in the same units as your original data, making it more interpretable.
Ignoring outliers – Standard deviation is sensitive to extreme values. A single outlier can dramatically increase your result. Consider whether outliers should be included or if you need robust statistical measures. For data sorting and analysis preparation, our statistical analysis tool offers additional functionality.
Expert Tips
When comparing datasets, use the coefficient of variation (CV) rather than raw standard deviation. CV expresses standard deviation as a percentage of the mean, allowing fair comparison between datasets with different scales or units.
For normally distributed data, approximately 68% of values fall within one standard deviation of the mean, 95% within two, and within three—known as the empirical rule or 68-95-99.7 rule.
Start Your Statistical Analysis
Enter your dataset above to instantly calculate standard deviation, variance, mean, and more. Our calculator provides accurate results for any dataset size along with step-by-step solutions for verification and learning.
For comprehensive statistical analysis resources, explore Math & Scientific Calculators section which includes tools for probability, permutations, and advanced mathematical operations.
This calculator uses standard statistical formulas recognized by educational institutions and professional organizations worldwide. Results match those produced by statistical software packages and graphing calculators.